Fractals in Maple / Fraktale w Maple
|
This worksheet contains a number of procedures in Maple that plot or deal with fractals. Some of these procedure I wrote myself, but a significant number of them I've collected on the web and made some slight changes (unfortunatelly it's impossible to acknowledge the authors of some of these procedures now). This worksheet should work fine with Maple 10, altough it should also work with older versions of Maple. Please feel free to email me comments.
|
Ten arkusz zawiera zestaw procedur Maple ktore w taki lub inny sposob sa zwiazane z fraktalami. Wiekszosc to procedury produkujace graficzne prezentacje pewnych zagadnien z dziedziny fraktali. Czesc tych procedur napisalem sam, jednak spora ich ilosc znalazlem w Internecie i przerobilem do moich potrzeb (Niestety dzisiaj trudno ustalic autorow pierwszych wersji tych procedur, wszystkim jednak dziekuje). Ten arkusz powinien dzialac z Maple 10, jednak takze w starszych wersjach nie powinno byc wiekszych problemow. Z gory dziekuje za uwagi i kometarze przeslane emailem.
|
|
Feingenbaum diagram / Diagram Feingenbauma
|
To clear the things up
|
Czyścimy środowisko
|
|
|
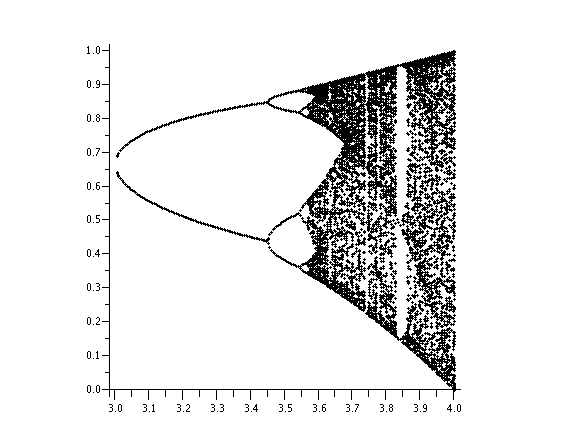
The procedure for plotting Feingenbaum diagram between x1-x2 and y1-y2, with "numpoints" of points.
|
Procedura rysujaca diagram Feingenbauma w przedziale x1-x2 x y1-y2, pozioma ilosc punktow kontrolowana jest przez zmienna "numpoints".
|
|
feingenbaum:=proc(x1,x2,y1,y2,numpoints)
 local g,f,dt;
	g:=proc(a)
		global x;
		x:=evalhf(x*a*(1-x));
		if ((y1 < x)and(x<=y2)) then return [a,x]; else return [a,y1]; fi;
	end:
	f:=proc(a)
		local i,b;
		global x;
		x:=0.8;
		for i to 150 do x:=evalhf(x*a*(1-x)) od;
		seq(g(a),b=0..100)
	end:
 dt:=(x2-x1)/numpoints;
 return seq(f(dt*i+x1),i=1..numpoints):
end:
|
Example usage - caution - using more than a 1000 points might take a while to draw.
|
Przyklad uzycia - uwaga - pry ilosci punktow wiekszej niz 1000 generowanie wykresu moze chwile trwac.
|
|
s:=feingenbaum(3,4,0,1,200):
plots[pointplot]([s],style=POINT,symbol=POINT,scaling=CONSTRAINED);
|
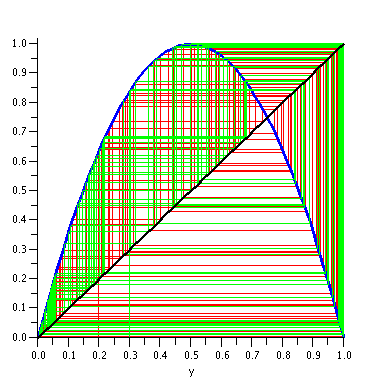
Bifurcation procedure - plots orbits of "x0" with respect to logistic map with parameter "a". The length of an orbit is defined by "m". Use "col" for setting orbits color (usefull for plotting multiple orbits)
|
Procedura bifurcation - rysuje orbity punkto "x0" w przeksztalceniu logistycznym dla danego parametru "a". Dlugosc orbity definiowana jest parametrem "m". Użyj zmiennej "col" do zdefiniowania koloru orbity (użyteczne przy wykreślaniu wielu orbit).
|
|
bifurcation:=proc(a,x0,m,col)
 local pts,transform_point,f,i;

	f:=proc(c,x)
		return c*x*(1-x);
	end;

	transform_point:=proc(pt)
		if (pt[2]=0) then return ([pt[1],f(a,pt[1])]);
		elif (pt[1]=pt[2]) then return ([pt[1],f(a,pt[1])]);
		elif (true) then return ([pt[2],pt[2]]); fi;
	end;

 pts:=[[x0,0]];

 for i from 0 to m do
	pts:=[op(pts),transform_point(pts[nops(pts)])];
 od;
 return {listplot(pts,color=col),
 plot(y*a*(1-y),y=0..1,color=blue,thickness=2),
 plot(y,y=0..1,color=black,thickness=2)}
end:
|
Example of "bifurcation"
|
Przyklad uzycia
|
|
display(bifurcation(4,0.2,200,red),bifurcation(4,0.3,200,green));
|
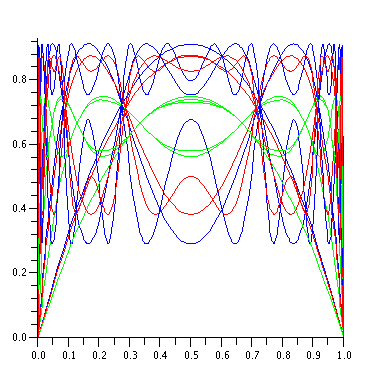
Procedure "critical" displays n-th iteration of logistic map with parameter "a". This reveals the critical lines (levels at which function oscilates). Use "col" to set up plots color.
|
Procedura "critical" rysuje n-te zlozenie przeksztalcenia logistycznego z parametrem "a". Na wykresie tym widac linie ktyryczne pomiedzy ktorymi funkcja oscyluje. Uzyj zmiennej "col" by okreslic kolor wykresu.
|
|
critical := proc(n,a,col)
 local f, l, k;
 l := NULL;
 for k to n do
	l := l, plot({(unapply(a*y*(1-y),y)@@k)},0..1, color=col)
 od;
end:
|
Example of "critical"
|
Przyklad uzycia.
|
|
display({critical(5,3,green), critical(5,3.5,red),critical(5,3.65,blue)});
Lorenz Attractor / Atraktor Lorenza
|
To clear the things up
|
Czyścimy środowisko
|
|
|
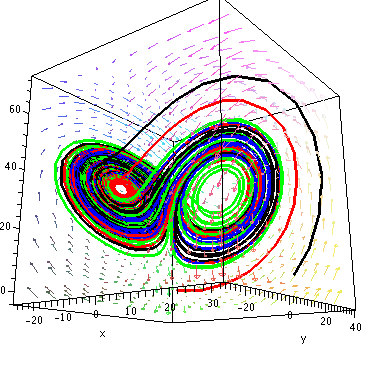
Lorenz procedure computes trajectories within the Lorenz attractor for sigma,r and b parameters. The computation precission is given by numpoints variable, whereas the
starting point by "rp". By default the trajectory length is 15.
|
Procedura wyliczajaca trajektorie w atraktorze Lorenza dla parametrow sigma,r,b. Rodzielczosc probkowania dawana jest przez ilosc punktow, zas punkt startowy przez rp. Domyslnie trajektoria ma dlugosc 15.
|
|
Lorenz:=proc(sigma,b,r,numpoints,rp)
 local Eq1,Eq2,Eq3,t0,dt,s,sol,r0,i,t1,t2,rf,tf;
 Eq1:=diff(x(t),t)=sigma*(y(t)-x(t)):
 Eq2:=diff(y(t),t)=r*x(t)-y(t)-x(t)*z(t):
 Eq3:=diff(z(t),t)=x(t)*y(t)-b*z(t):
 t1:=0:
 t2:=15:
 dt:=(t2-t1)/numpoints:
 r0:=rp;
 for i from 1 to numpoints do
	s:=dsolve({Eq1,Eq2,Eq3,x(0)=r0[1],y(0)=r0[2],z(0)=r0[3]},{x(t),y(t),z(t)},type=numeric):
	t0:=t1+(i-1)*dt:
	tf:=t0+dt:
	sol:=s(tf-t0):
	rf[i]:=[rhs(op(2,sol)),rhs(op(3,sol)),rhs(op(4,sol))]:
	r0:=rf[i]:
 od:
 return [seq(rf[i],i=1..numpoints)]:
end:
|
An example - four trajectories are computed.
|
Przyklad uzycia - wyliczane sa 4 trajektorie.
|
|
r0:=[1,1,1];
L:=Lorenz(10,8/3,35,1000,r0):
r0:=[0,20,20];
L1:=Lorenz(10,8/3,35,1000,r0):
r0:=[20,0,20];
L2:=Lorenz(10,8/3,35,1000,r0):
r0:=[20,20,0];
L3:=Lorenz(10,8/3,35,1000,r0):
|
Now we create some curves to display
|
Tworzymy krzywa do wyswietlania
|
|
s0:=spacecurve({L},thickness=2,color=red):
s1:=spacecurve({L1},thickness=2,color=green):
s2:=spacecurve({L2},thickness=2,color=blue):
s3:=spacecurve({L3},thickness=2,color=black):
|
Now we crate a vector field that displays forces in Lorenz attractor
|
Tworzymy pole wektorowe atraktora Lorenza
|
|
r:=35;
sigma:=10;
b:=8/3;
k:=fieldplot3d([sigma*(y-x),r*x-y-x*z,x*y-b*z],x=-25..30,y=-25..35,z=0..70,
grid=[10,10,10],arrows=SLIM,thickness=1):
|
The final plot
|
Wykres w calej okazalosci
|
|
display({s0,s1,s2,s3,k},projection=0.7,orientation=[-53,107],axes=boxed);
Mandelbrot set / Zbiór Mandelbrota
|
To clear the things up
|
Czyścimy środowisko
|
|
|
Procedure Mandelbrot is used to plot Mandelbrot set (returns a number of iterations required to escape from a circle of radius 2 on a complex plane)
|
Procedura rysujaca zbior Mandelbrota (zwraca ilosc iteracji potrzebna do wyjsca poza okrag o promieniu 2 na płaszczyźnie zespolonej)
|
|
mandelbrot:=proc(x,y)
  local z,ct,xn,xnold,yn,iter;
  iter:=25;
  Digits:=10;
  xn:=x;
  yn:=y;
  for ct from 1 while ct
|
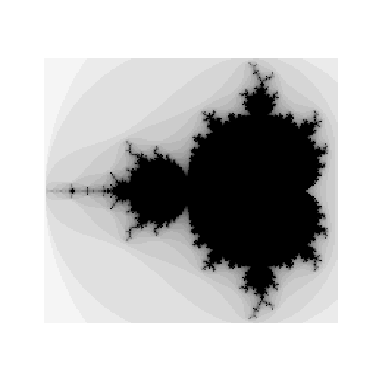
Density plot works slower than expected, but produces the following plot
|
Density plot dziala wolno (nie wiadomo dlaczego), produkuje następujący wykres
|
|
densityplot('mandelbrot'(x,y),x=-2..0.55,y=-1.15..1.15,grid=[200,200],
scaling=constrained,style=PATCHNOGRID,axes=NONE);
|
Plot3d works faster and allows colors
|
Plot3d dziala znacznie szybciej
|
|
mm:=plot3d(-2,-2..0.55,-1.15..1.15,orientation=[270,0], grid=[150,150],style=patchnogrid,
shading=zgrayscale,scaling=constrained,color=mandelbrot):
|
Procedure fein_m produces a Feingenbaum diagram for z^2+c transformations (restricted to real axis).
|
Procedura produkujaca diagram Feingenbauma dla przeksztalcenia z^2+c na osi rzeczywistej.
|
|
fein_m:=proc(x1,x2,numpoints)
local g,f,dt;
 g:=proc(a)
 global x;
   x:=evalhf(x*x+a);
   if (x>4) then x:=0; fi;
   [a,0,x];
end:
 f:=proc(a)
 local i,b;
 global x;
   x:=0.8;
   for i to 150 do x:=evalhf(x*x+a) od;
   seq(g(a),b=0..100)
 end:

dt:=(x2-x1)/numpoints;
return seq(f(dt*i+x1),i=1..numpoints):
end:
|
Feingenbaum diagram between -2 and 0.15 with 500 points
|
Stworzenie diagramu Feingenbauma
|
|
s:=fein_m(-2,0.15,500):
f_m:=spacecurve([s],style=point):
|
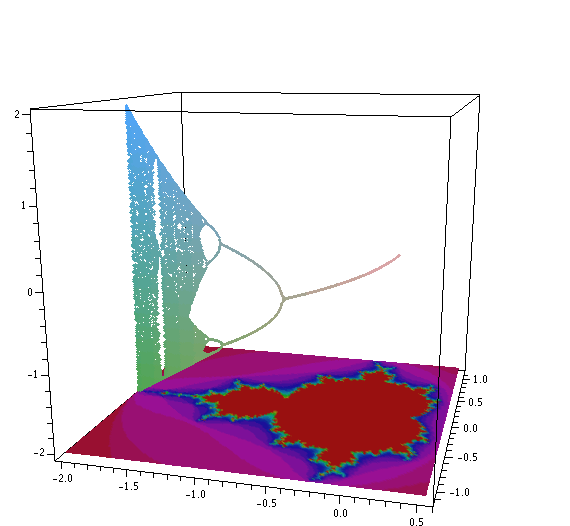
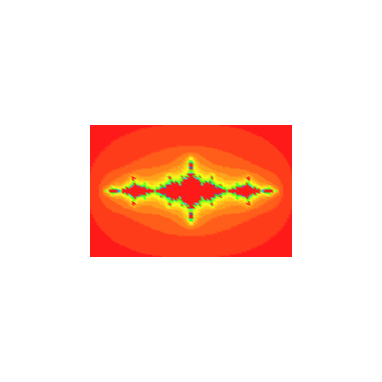
The following plot displays Mandelbrot set and correspoding Feingenbaum diagram. Please note the striking correspondence between these two objects.
|
Wykres przedstawia zbiór mandelbrota i odpowiadający temu samemu przekształceniu diagram Feingenbauma. Proszę zwrócić uwagę na cech wspólne tych wykresów.
|
|
display(f_m,mm,orientation=[-75,76],projection=0.7,lightmodel=light4,axes=boxed,
scaling=unconstrained);
|
Procedure orbits plots orbits on a complex plane with respect to z^2+c transformations (of Mandelbrot kind).
|
Procedura rysujaca orbity na płaszczyźnie zespolonej dla przeksztalcenia z^2+c (typu Mandelbrota).
|
|
restart:
orbits := proc(x, y, iter)
    local c, z, pts;
    pts := NULL;
    c := evalf(x+y*I);
    z := c;
    to iter do
       if abs(z) < 1e10 then
          pts := pts, [Re(z), Im(z)]
       fi;
       z := z^2+c
    od;
    [pts]
end:
|
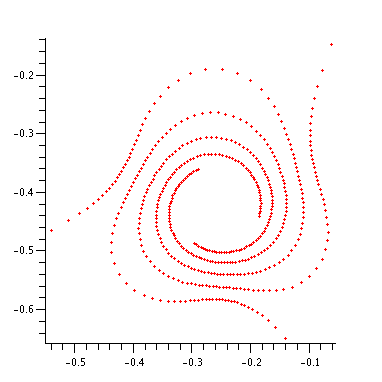
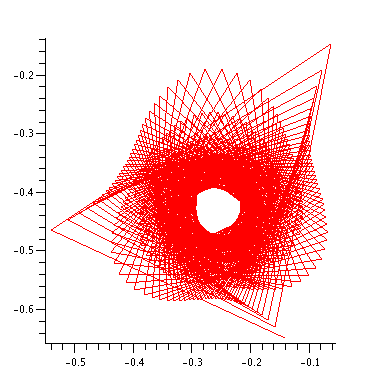
Some example orbits.
|
Kilka wykresow orbit.
|
|
plot(orbits(-0.14222874119878, -0.64732701703906, 500), style=point,
symbol=POINT, axes=framed, scaling=constrained);
 plot(orbits(-0.14222874119878, -0.64732701703906, 500), style=line,
symbol=POINT, axes=framed, scaling=constrained);
plot(orbits(-0.14222874119878, -0.64732701703906, 500), style=line,
symbol=POINT, axes=framed, scaling=constrained);
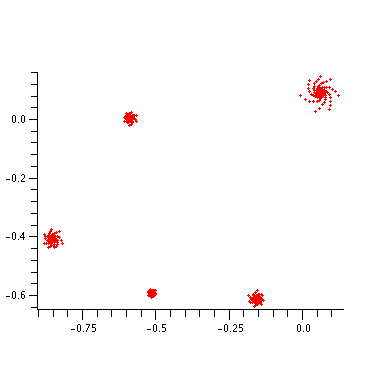
 plot(orbits(-0.50977517291904, -0.60039090737700, 500), style=point,
symbol=POINT, axes=framed, scaling=constrained);
plot(orbits(-0.50977517291904, -0.60039090737700, 500), style=point,
symbol=POINT, axes=framed, scaling=constrained);
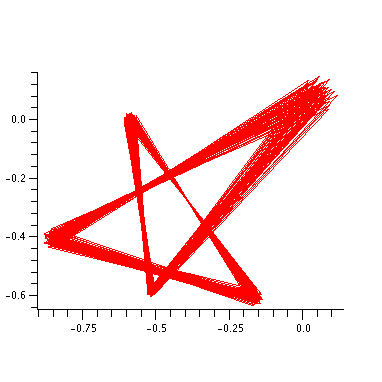
 plot(orbits(-0.50977517291904, -0.60039090737700, 300), style=line,
axes=framed, scaling=constrained);
plot(orbits(-0.50977517291904, -0.60039090737700, 300), style=line,
axes=framed, scaling=constrained);
|
Orbits3d plots orbits in 3d with iteration number (time) as a third dimension.
|
Proceura rysujaca orbity z 3 wspolrzedna (czasem) w 3d.
|
|
orbits3d := proc(x, y, iter)
    local c, z, pts, i;
    pts := NULL;
    c := evalf(x+y*I);
    z := c;
    for i to iter do
       if abs(z) < 1e10 then  # avoid overflow
          pts := pts, [Re(z), Im(z), i]
       fi;
       z := z^2+c
    od;
    [pts]
 end:
|
Sample plot
|
Przykładowy wykres
|
|
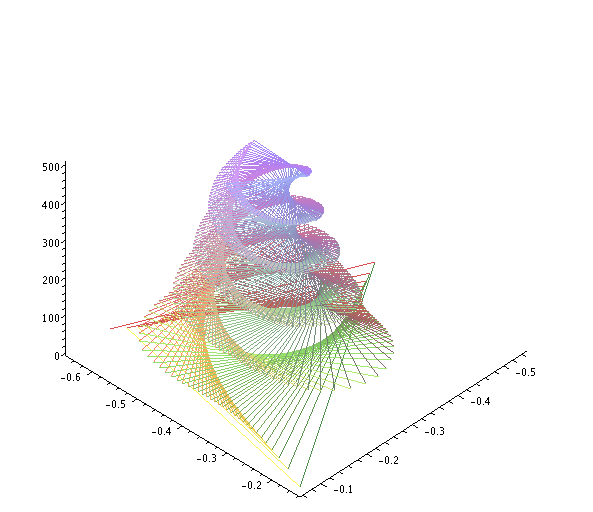
plots[spacecurve](orbits3d(-0.14222874119878, -0.64732701703906, 500),
   x=-2 .. 2, y=-2 .. 2, style=line, axes=framed, orientation=[44, 44]);
Julia Sets / Zbiory Julii
|
Procedure julia is used to plot Julia sets. Returns number of iterations required to escape from a circle of radius 3 on a complex plane.
|
Procedura rysujaca zbiory Julii. Zwraca ilość iteracji potrzebną do opuszczenia koła o promieniu 3 na płaszczyźnie zespolonej.
|
|
restart; with(plots):

 julia := proc(c,x,y)
    local z, m,xn,yn,iter,xnold;
    iter:=40;
    Digits:=10;
    xn:=x;
    yn:=y;
    for m from 0 to iter while evalhf(sqrt(xn^2+yn^2))< 3 do
      xnold:=xn;
      xn:=evalhf(xn^2-yn^2+Re(c));
      yn:=evalhf(2*xnold*yn+Im(c));
    od;
    m
 end:

 J := proc(d)
    global phonyvar;
    phonyvar := d;
    (x, y) -> julia(phonyvar, x, y)
 end:
|
Some example plots (you may also try densityplot as in previous chapter).
|
Zbior Julii (można też użyć densityplot jak w poprzednim rozdziale).
|
|
plot3d(0, -2 .. 2, -1.3 ..1.3, style=patchnogrid,
    orientation=[-90,0], grid=[100, 100],
    scaling=constrained, color=J(-1.25));
|
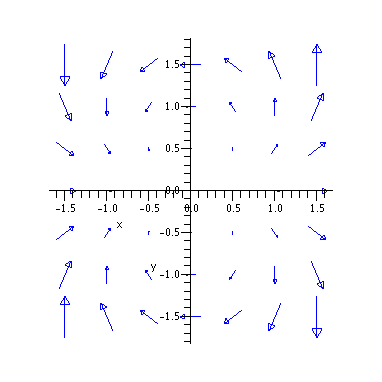
Complex plane transformations (of Julia type) as vector fields.
|
Wektorowe przeksztalcenia na plaszczyznie zespolonej.
|
|
fieldplot( [x^2-y^2,2*x*y],x=-1.5..1.5,y=-1.5..1.5,scaling=constrained,arrows=SLIM,
color=blue,thickness=3,labels=["Re","Im"],grid=[11,11]);
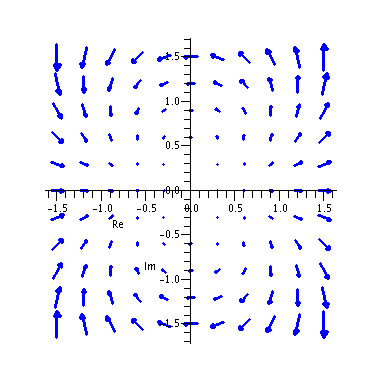 fieldplot([x^2-y^2,2*x*y],x=-1.5..1.5,y=-1.5..1.5,scaling=constrained,
arrows=SLIM,color=blue,grid=[7,7]);
fieldplot([x^2-y^2,2*x*y],x=-1.5..1.5,y=-1.5..1.5,scaling=constrained,
arrows=SLIM,color=blue,grid=[7,7]);
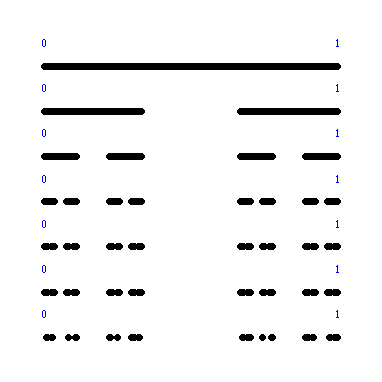
Cantor Set / Zbiór Kantora
|
Some auxilary procedures used to plot consecutive approximations of Cantor set.
|
Pewne pomocnicze procedury używane przy wykreślaniu kolejnych aproksymacji zbioru Kantora.
|
|
with(plots):
line := proc(a:: list, b:: list)
    local plotoptionen, n;
    if nargs > 2 then
       plotoptionen := seq(args[n], n=3 .. nargs)
    else
       plotoptionen := NULL
    fi;
    plot([a, b], style=line, plotoptionen);
 end:
cree_segment := (a,b,h) -> line([a,h],[b,h],color=black):
f1:=x->x/3: f2:=x->(x+2)/3:

f := s -> s union map(f1, s) union map(f2, s):

sequence_de_segments := proc(l,h)
local accu, i;
accu := NULL;
for i to nops(l) by 2 do
  accu := accu,cree_segment(l[i], l[i+1], h) od;
 accu
end:

Cantor := proc(n) local s, i;
 option remember;
 s := sequence_de_segments([0,1], 1);
 for i from 1 to n do
 s := sequence_de_segments(sort([op((f@@i)({0,1}))]), (1-i/n)), s;
 od;
 display({s}union{seq(textplot([[0,(i+1/2)/n, `0`], [1, (i+1/2)/n, `1`]]
 ), i=0 .. n)}, color=blue,axes=NONE,thickness=7)
 end:
|
Example usage (argument specifies recurence depth)
|
Przykładowe użycie (argument określa głębokość rekurencji);
|
|
Cantor(6);
IFS - Iterated function systems / Składanie przekształceń geometrycznych
|
Some auxilary procedures that will be used in the following programs.
|
Pomocnicze procedury które będą używane w dalszym programie.
|
|
transforme_point := proc(t, p)
    [t[1]*p[1]+t[2]*p[2]+t[5], t[3]*p[1]+t[4]*p[2]+t[6]]
 end:

 transforme_triangle := proc(t, triangle)
    local i;
    [seq(transforme_point(t, triangle[i]), i=1 .. 3)]
 end:

 transform_square := proc(t, square)
    local i;
    [seq(transforme_point(t, square[i]), i=1 .. 4)]
 end:
|
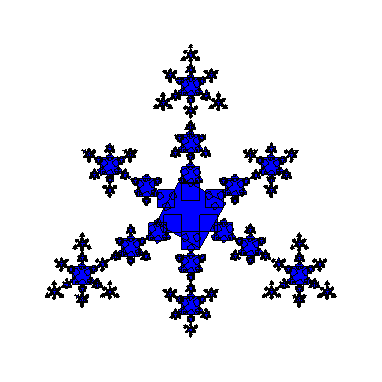
IFS transforms a triangle according to list of transformations given in parameter. The color of triangles interior is given by "col".
|
IFS transformuje trójkąt zgodnie z podaną listą przekształceń geometrycznych. Kolor wnętrza trójkąta dany jest zmienną "col".
|
|
 IFS := proc(n, liste_de_transformations,col)
    local i, j, k, s, sequence_de_triangles:
    options `Copyright by Alain Schauber, 1996`;
    sequence_de_triangles := [[0, 0], [1, 0], [0.5, 1]];
    for j to n do
    s := NULL;
    for i to nops(liste_de_transformations) do
       s := s,
       seq(transforme_triangle(liste_de_transformations[i],
       op(k, [sequence_de_triangles])),
       k=1 .. nops([sequence_de_triangles]))
      od;
     sequence_de_triangles := s
    od;
   plots[polygonplot]([sequence_de_triangles], axes=none,
      color=col, scaling=constrained)
 end:
|
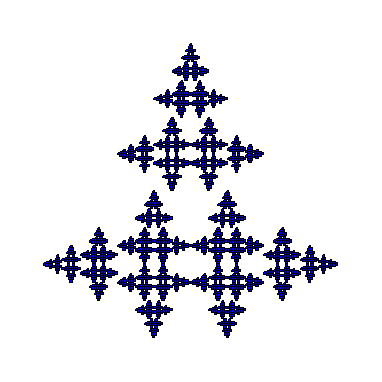
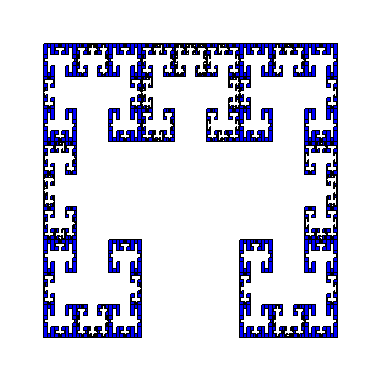
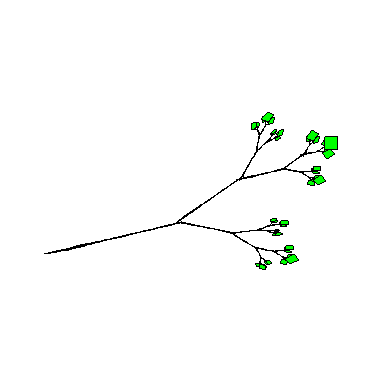
IFS transforms a square according to list of transformations given in parameter. The color of squares interior is given by "col".
|
IFS transformuje kwadrat zgodnie z podaną listą przekształceń geometrycznych. Kolor wnętrza kwadratu dany jest zmienną "col".
|
|
IFSS := proc(n, liste_de_transformations,col)
    local i, j, k, s, seq_square:
    seq_square :=[[0,0],[1,0],[1,1],[0,1]];
    for j to n do
    s := NULL;
    for i to nops(liste_de_transformations) do
       s := s,
       seq(transform_square(liste_de_transformations[i],
       op(k, [seq_square])),
       k=1 .. nops([seq_square]))
     od;
     seq_square := s
   od;
   plots[polygonplot]([seq_square], axes=none,
      color=col, scaling=constrained)
 end:
|
And now a list of some nice transformations (it is easy to create some new)
|
A teraz lista ciekawych przekształceń (łatwo stworzyć nowe przykłady)
|
|
tamis_de_Sierpinski:=
[[0.5,0,0,0.5,0,0],[0.5,0,0,0.5,0.5,0],[0.5,0,0,0.5,0.25,0.5]]:
cantor:=
[[evalf(1/3),0,0,evalf(1/3),0,0],[evalf(1/3),0,0,evalf(1/3),evalf(2/3),0]]:
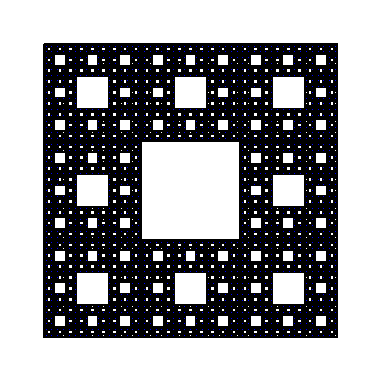
dywan:=
[[evalf(1/3),0,0,evalf(1/3),0,0],
[evalf(1/3),0,0,evalf(1/3),evalf(1/3),0],
[evalf(1/3),0,0,evalf(1/3),evalf(2/3),0],
[evalf(1/3),0,0,evalf(1/3),0,evalf(2/3)],
[evalf(1/3),0,0,evalf(1/3),evalf(1/3),evalf(2/3)],
[evalf(1/3),0,0,evalf(1/3),evalf(2/3),evalf(2/3)],
[evalf(1/3),0,0,evalf(1/3),0,evalf(1/3)],
[evalf(1/3),0,0,evalf(1/3),evalf(2/3),evalf(1/3)]
]:
arbre_de_Noel_double:=
[[0,-.5,.5,0,.5,0],[0,.5,-.5,0,.5,.5],[.5,0,0,.5,.25,.5]]:
labyrinthe_de_Sierpinski:=
[[evalf(1/3),0,0,evalf(1/3),evalf(1/3),evalf(2/3)],
[0,evalf(1/3),1,0,evalf(2/3),0],
[0,-evalf(1/3),1,0,evalf(1/3),0]]:
rameau:=
[[.387,.430,.430,-.387,.2560,.5220],
[.441,-.091,-.009,-.322,.4219,.5059],
[-.468,.020,-.113,.015,.4,.4]]:
cristal:=
[[.255,0,0,.255,.3726,.6714],[.255,0,0,.255,.1146,.2232],
[.255,0,0,.255,.6306,.2232],[.37,-.642,.642,.37,.6356,-.0061]]:
mecano:=
[[.382,0,0,.382,.3072,.619],[.382,0,0,.382,.6033,.4044],
[.382,0,0,.382,.0139,.4044],[.382,0,0,.382,.1253,.0595],
[.382,0,0,.382,.492,.0595]]:
feu:=
[[evalf(1/3),0,0,evalf(1/3),0,0],
[evalf(1/6),evalf(-sqrt(3)/6),evalf(sqrt(3)/6),evalf(1/6),evalf(1/3),0],
[evalf(-1/6),evalf(-sqrt(3)/6),evalf(sqrt(3)/6),evalf(-1/6),
evalf(2/3),0],[evalf(1/3),0,0,evalf(1/3),evalf(2/3),0]]:
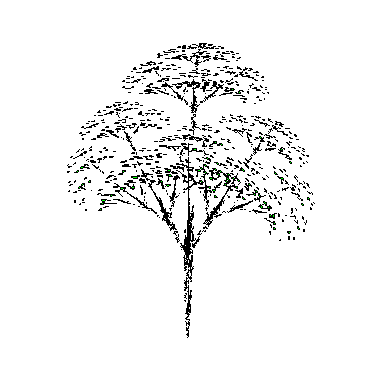
arbre:=
[[.195,-.488,.344,.443,.4431,.2452],[.462,.414,-.252,.361,.2511,.5692],
[-.058,-.07,.453,-.11,.5976,.0969],[-.035,.07,-.469,-.022,.4884,.5069],
[-.637,0,0,.501,.8562,.2513]]:
maple :=
[[0.29, 0.4, -0.4, 0.3, 0.28, 0.44],
[0.33, -0.34, 0.39, 0.4, 0.41, 0],
[0.42, 0, 0, 0.63, 0.29, 0.36],
[0.61, 0, 0, 0.61, 0.19, 0.23],
[0.01, 0, 0, 0.29, 0.5, 0.13]]:
tab15 :=
[[-0.04, 0, -0.23, -0.65, -0.08, 0.26],
[0.61, 0, 0, 0.31, 0.07, 2.5],
[0.65, 0.29, -0.3, 0.48, 0.54, 0.39],
[0.64, -0.3, 0.16, 0.56, -0.56, 0.4]]:
koch:=
[[evalf(1/3), 0, 0, evalf(1/3), 0, 0],
[evalf(1/3), 0, 0, evalf(1/3), evalf(2/3),0],
[evalf(1/6),evalf(-sqrt(3)/6),evalf(sqrt(3)/6),evalf(1/6),evalf(1/3),0],
[-evalf(1/6),evalf(sqrt(3)/6),evalf(sqrt(3)/6),evalf(1/6),evalf(2/3),0]]:
tab21 :=
[[0, 0, 0, 0.5, 0, 0],
[0.4, -0.4, 0.4, 0.4, 0, 0.2],
[0.4, 0.4, -0.4, 0.4, 0, 0.2]]:
|
Example plots
|
Przykładowe wykresy
|
|
IFS(6,tamis_de_Sierpinski,blue);
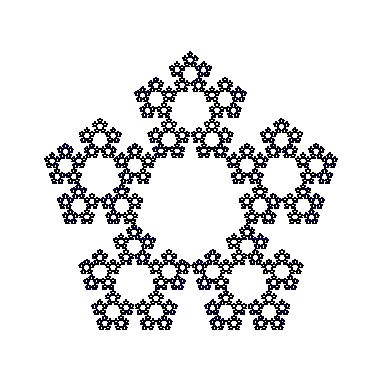
 IFSS(7,arbre_de_Noel_double,blue);
 IFSS(7,labyrinthe_de_Sierpinski,blue);
 IFSS(6,rameau,green);
 IFSS(7,cristal,blue);
 IFS(5,mecano,blue);
 IFS(6,feu,black);
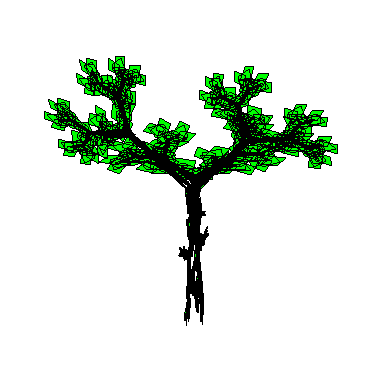
 IFSS(5,arbre,green);
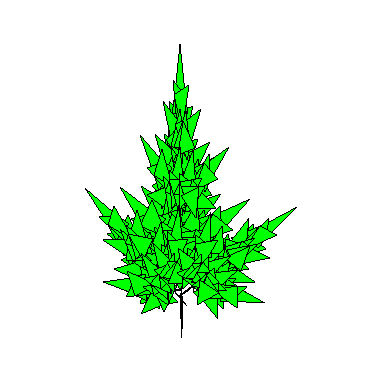
 IFS(4, maple,green);
 IFS(6, tab15, green);
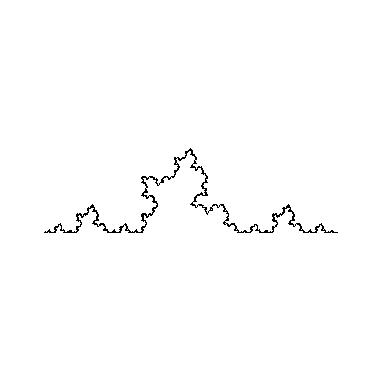
 IFS(6, koch, black);
 IFSS(9, tab21, green);
 IFSS(5, dywan, blue);
 IFSS(3, cantor,blue);
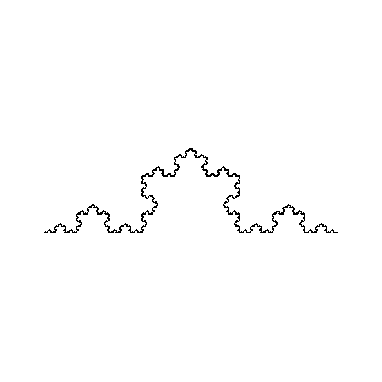
Koch curve / Krzywa Kocha
|
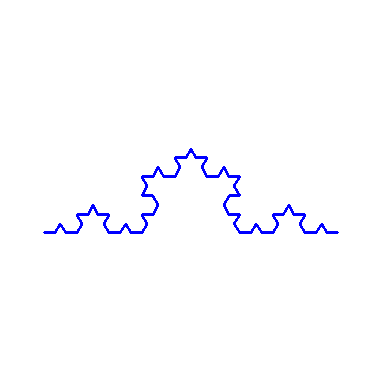
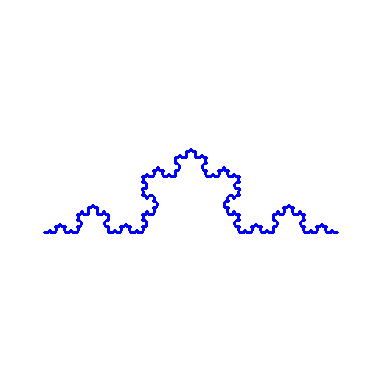
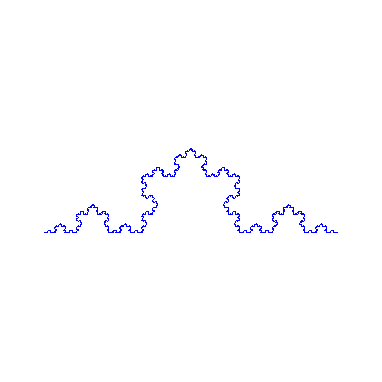
Procedure Koch creates n-th approximation of Koch's curve
|
Procedura Koch generuje n-tą aproksymację krzywej Kocha
|
|
koch := proc(p:: numeric)
    local m, n, k, l, s, h, x, y, pts, t, i;
    h := 3^(-p);
    pts := table([]): # [0, 0];
    pts[0]:=[0,0];
    x := 0; y := 0;
    for n from 0 to (4^p) do
       m := n;
       s := 0;
       for l from 0 to p-1 do
          t := irem(m, 4);
          m := iquo(m, 4);
          s := s+irem((t+1), 3) - 1
       od;  # end of for l
       x := evalhf(x+cos(Pi*s/3)*h);
       y := evalhf(y+sin(Pi*s/3)*h);
       pts[n+1] := [x, y];
    od;
   [seq(pts[i], i=0 .. n-1)];
 end:
|
Examples
|
Przykładowe wykresy
|
|
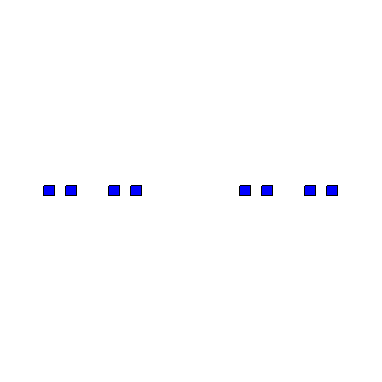
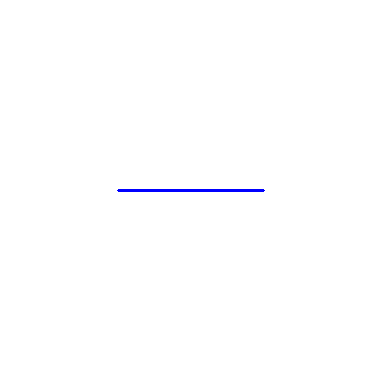
plot(koch(0), scaling=constrained, style=LINE, axes=NONE, color=blue,thickness=2);
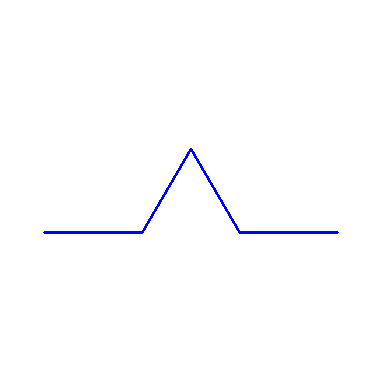
 plot(koch(1), scaling=constrained, style=LINE, axes=NONE, color=blue,thickness=2);
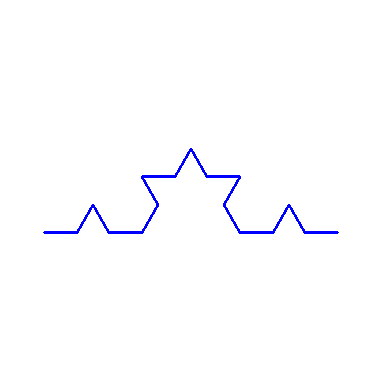
 plot(koch(2), scaling=constrained, style=LINE, axes=NONE, color=blue,thickness=2);
 plot(koch(3), scaling=constrained, style=LINE, axes=NONE, color=blue,thickness=2);
 plot(koch(4), scaling=constrained, style=LINE, axes=NONE, color=blue,thickness=2);
 plot(koch(5), scaling=constrained, style=LINE, axes=NONE, color=blue,thickness=1);
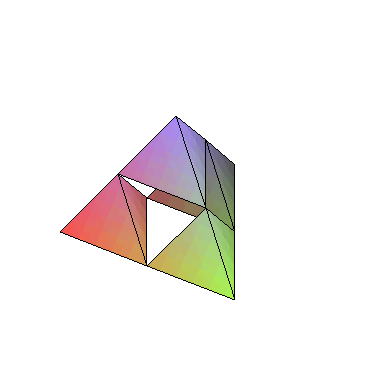
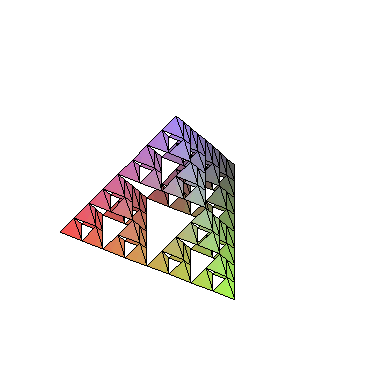
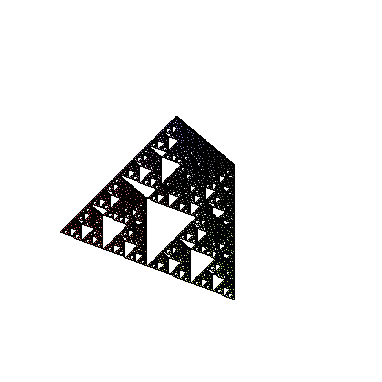
Sierpinski Pyramid / Piramida Sierpińskiego
|
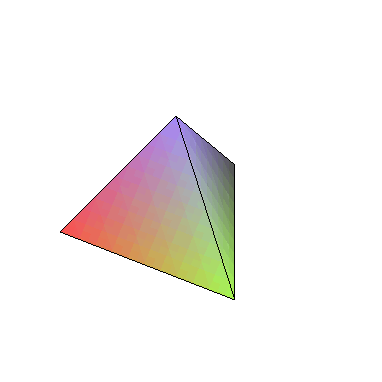
Procedure Tetra creates a tetraedron based on the list of vertices. Procedure Midpoint returns middle point of a section i 3d. Procedure Refine makes a single step
of Sierpinski Pyramid creation by subsituting middle tetraedron from the original. Procedure RefineAll does that for a list of tetraedrons. Procedure Recurse applies
RefineAll (given as argument "f") to all tetraedron from a given input list, up to an n-th level. FirstT defines first tetraedron.
|
Procedura Tetra tworzy pojedynczy czworościan na podstawie listy wierzchołków. Procedura Midproint zwraca środek odcinka danego przez punkty końcowe w 3d.
Procedura Refine wykonuje jeden krok konstrukcji piramidy Sierpińskiego poprzed usunięcie pojedynczego czworościanu ze środka oryginalnego. Procedura RefineAll wykonuje
Refine dla wszystkich elementów danej listy czworościanów. Procedura Recurse aplikuje RefineAll (podaną w argumencie "f") dla wszystkich elementów listy wejściowej ("input"), na n-tym poziomie rekursji. FirstT definiuje pierwszy z serii czworościanów.
|
|
Tetra := proc(verts)
       local a,b,c,d;
       a := verts[1];
       b := verts[2];
       c := verts[3];
       d := verts[4];
       RETURN( [[a,b,c], [a,b,d], [a,c,d], [b,c,d]]);
end:

Midpoint := proc(a,b)
    RETURN( [(a[1]+b[1])/2, (a[2]+b[2])/2, (a[3]+b[3])/2]);
  end:


Refine := proc (tetra)
      local a,b,c,d;
      a:=tetra[1];
      b:=tetra[2];
      c:=tetra[3];
      d:=tetra[4];
       RETURN( [a, Midpoint(a,b), Midpoint(a,c), Midpoint(a,d)],
               [b, Midpoint(a,b), Midpoint(b,c), Midpoint(b,d)],
               [c, Midpoint(c,b), Midpoint(a,c), Midpoint(c,d)],
               [d, Midpoint(d,b), Midpoint(d,c), Midpoint(a,d)]);
      end:

RefineAll := proc(tlist)
    RETURN(map(Refine,tlist));
  end:

Recurse := proc(f, input, n)
    if ( n <= 0) then
       RETURN(input);
    else
       RETURN(Recurse(f, f(input), n-1));
    fi;
  end:

FirstT := [[-1,-1,0],[0,sqrt(3)-1,0],[1,-1,0],[0,sqrt(3)/3-1,2*sqrt(15)/5]]:
|
Now we setup some plotting options to Maple.
|
Ustawiamy opcje wyświetlania wykresów w Maple'u.
|
|
with(plots):
setoptions3d(axes=none, scaling=constrained,shading=XYZ,style=patch,orientation=[60,48]);
|
And now to some example plots
|
A teraz przykładowe wykresy
|
|
polygonplot3d(map(Tetra,[(FirstT)]));

polygonplot3d(map(Tetra,[Refine(FirstT)]));

polygonplot3d(map(Tetra,Recurse(RefineAll,[FirstT],2)));

polygonplot3d(map(Tetra,Recurse(RefineAll,[FirstT],3)));

polygonplot3d(map(Tetra,Recurse(RefineAll,[FirstT],4)));

polygonplot3d(map(Tetra,Recurse(RefineAll,[FirstT],5)))

polygonplot3d(map(Tetra,Recurse(RefineAll,[FirstT],6)))
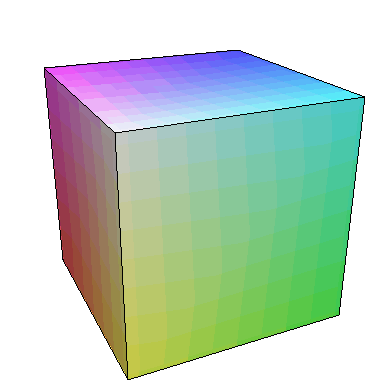
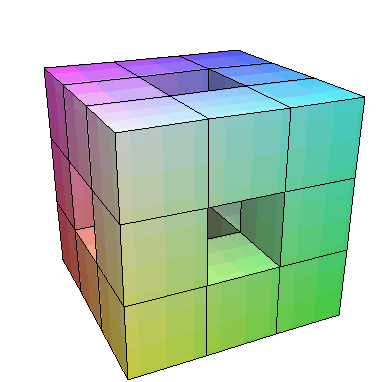
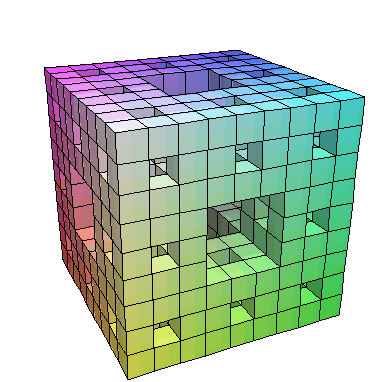
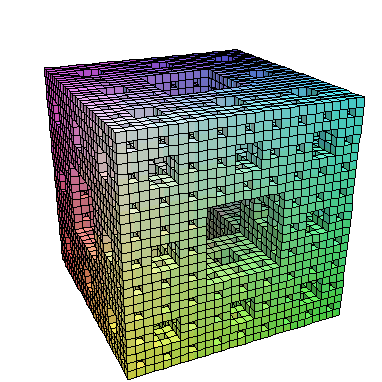
Menger Sponge / Gąbka Mengera
|
Procedure Cube creates a cube based on the list of vertices.
Procedures Midpoint13 and Midpoint23 are auxilary procedures corresponding to Midpoint procedure from previous Chapter, they return points in one third
and two thirds of the original.
Procedure Refine makes a single step in Menger sponge iteration by substituting 7 small cubes from the original.
RefineAll repeats Refine for all cubes in the list.
Recurse applies RefineAll recusively.
FirstC defines frist cube used in latter procedures.
|
Procedura Cube tworzy sześcian na podstawie listy wierzchołków.
Procedury Midpoint13 i Midpoint23 to pomocnicze procedury odpowiadające Midpoint z poprzedniego rozdziału, zwracają odpowiednio jedną trzecią i dwie
trzecie orginalnego odcinka.
Procedura Refine wykonuje jeden krok konstrukcji gąbki Mengera poprzez odjęcie siedmiu małych sześcianów z podanego wejściowego sześcianu.
Pocedura RefineAll powtarza Refine dla wszytkich sześcianów danych w liście wejściowej.
Procedura Recurse powtarza RefineAll rekursywnie.
FirstC definiuje pierwszy z serii dalej wykorzystywanych sześcianów.
|
|
Cube := proc(verts)
       local a,b,c,d,e,f,g,h;
       a := verts[1];
       b := verts[2];
       c := verts[3];
       d := verts[4];
       e := verts[5];
       f := verts[6];
       g := verts[7];
       h := verts[8];
       RETURN( [[a,b,c,d],[a,b,f,e],[b,c,g,f],[c,g,h,d],[d,a,e,h],[e,f,g,h]]);
end:

Midpoint13 := proc(a,b)
    RETURN( [(a[1]+b[1])/3, (a[2]+b[2])/3, (a[3]+b[3])/3]);
  end:
Midpoint23 := proc(a,b)
    RETURN( [(a[1]+b[1])*2/3, (a[2]+b[2])*2/3, (a[3]+b[3])*2/3]);
  end:


Refine := proc (cube)
      local a,b,c,d,e,f,g,h;
      a:=cube[1];
      b:=cube[2];
      c:=cube[3];
      d:=cube[4];
      e:=cube[5];
      f:=cube[6];
      g:=cube[7];
      h:=cube[8];

       RETURN( [a,
                Midpoint13(a,b)+1/3*a,
                Midpoint13(a,c)+1/3*a,
                Midpoint13(a,d)+1/3*a,
                Midpoint13(a,e)+1/3*a,
                Midpoint13(a,f)+1/3*a,
                Midpoint13(a,g)+1/3*a,
                Midpoint13(a,h)+1/3*a],
               [Midpoint13(a,b)+1/3*b,
                b,
                Midpoint13(b,c)+1/3*b,
                Midpoint13(b,d)+1/3*b,
                Midpoint13(b,e)+1/3*b,
                Midpoint13(b,f)+1/3*b,
                Midpoint13(b,g)+1/3*b,
                Midpoint13(b,h)+1/3*b],
               [Midpoint13(a,c)+1/3*c,
                Midpoint13(b,c)+1/3*c,
                c,
                Midpoint13(c,d)+1/3*c,
                Midpoint13(c,e)+1/3*c,
                Midpoint13(c,f)+1/3*c,
                Midpoint13(c,g)+1/3*c,
                Midpoint13(c,h)+1/3*c],
               [Midpoint13(a,d)+1/3*d,
                Midpoint13(b,d)+1/3*d,
                Midpoint13(c,d)+1/3*d,
                d,
                Midpoint13(d,e)+1/3*d,
                Midpoint13(d,f)+1/3*d,
                Midpoint13(d,g)+1/3*d,
                Midpoint13(d,h)+1/3*d],
               [Midpoint13(a,b)+1/3*a,
                Midpoint13(b,a)+1/3*b,
                Midpoint13(b,d)+1/3*b,
                Midpoint13(a,c)+1/3*a,
                Midpoint13(a,f)+1/3*a,
                Midpoint13(b,e)+1/3*b,
                Midpoint13(b,h)+1/3*b,
                Midpoint13(a,g)+1/3*a],
               [Midpoint13(b,d)+1/3*b,
                Midpoint13(b,c)+1/3*b,
                Midpoint13(c,b)+1/3*c,
                Midpoint13(c,a)+1/3*c,
                Midpoint13(b,h)+1/3*b,
                Midpoint13(b,g)+1/3*b,
                Midpoint13(c,f)+1/3*c,
                Midpoint13(c,e)+1/3*c],
               [Midpoint13(d,b)+1/3*d,
                Midpoint13(c,a)+1/3*c,
                Midpoint13(c,d)+1/3*c,
                Midpoint13(d,c)+1/3*d,
                Midpoint13(d,f)+1/3*d,
                Midpoint13(c,e)+1/3*c,
                Midpoint13(c,h)+1/3*c,
                Midpoint13(d,g)+1/3*d],
               [Midpoint13(a,d)+1/3*a,
                Midpoint13(a,c)+1/3*a,
                Midpoint13(d,b)+1/3*d,
                Midpoint13(d,a)+1/3*d,
                Midpoint13(a,h)+1/3*a,
                Midpoint13(a,g)+1/3*a,
                Midpoint13(d,f)+1/3*d,
                Midpoint13(d,e)+1/3*d],
               [Midpoint13(a,e)+1/3*a,
                Midpoint13(a,f)+1/3*a,
                Midpoint13(a,g)+1/3*a,
                Midpoint13(a,h)+1/3*a,
                Midpoint13(e,a)+1/3*e,
                Midpoint13(e,b)+1/3*e,
                Midpoint13(e,c)+1/3*e,
                Midpoint13(e,d)+1/3*e],
               [Midpoint13(b,e)+1/3*b,
                Midpoint13(b,f)+1/3*b,
                Midpoint13(b,g)+1/3*b,
                Midpoint13(b,h)+1/3*b,
                Midpoint13(f,a)+1/3*f,
                Midpoint13(f,b)+1/3*f,
                Midpoint13(f,c)+1/3*f,
                Midpoint13(f,d)+1/3*f],
               [Midpoint13(c,e)+1/3*c,
                Midpoint13(c,f)+1/3*c,
                Midpoint13(c,g)+1/3*c,
                Midpoint13(c,h)+1/3*c,
                Midpoint13(g,a)+1/3*g,
                Midpoint13(g,b)+1/3*g,
                Midpoint13(g,c)+1/3*g,
                Midpoint13(g,d)+1/3*g],
               [Midpoint13(d,e)+1/3*d,
                Midpoint13(d,f)+1/3*d,
                Midpoint13(d,g)+1/3*d,
                Midpoint13(d,h)+1/3*d,
                Midpoint13(h,a)+1/3*h,
                Midpoint13(h,b)+1/3*h,
                Midpoint13(h,c)+1/3*h,
                Midpoint13(h,d)+1/3*h],
               [Midpoint13(e,a)+1/3*e,
                Midpoint13(e,b)+1/3*e,
                Midpoint13(e,c)+1/3*e,
                Midpoint13(e,d)+1/3*e,
                e,
                Midpoint13(e,f)+1/3*e,
                Midpoint13(e,g)+1/3*e,
                Midpoint13(e,h)+1/3*e],
               [Midpoint13(e,b)+1/3*e,
                Midpoint13(f,a)+1/3*f,
                Midpoint13(f,d)+1/3*f,
                Midpoint13(e,c)+1/3*e,
                Midpoint13(e,f)+1/3*e,
                Midpoint13(f,e)+1/3*f,
                Midpoint13(f,h)+1/3*f,
                Midpoint13(e,g)+1/3*e],
               [Midpoint13(f,a)+1/3*f,
                Midpoint13(f,b)+1/3*f,
                Midpoint13(f,c)+1/3*f,
                Midpoint13(f,d)+1/3*f,
                Midpoint13(f,e)+1/3*f,
                f,
                Midpoint13(f,g)+1/3*f,
                Midpoint13(f,h)+1/3*f],
               [Midpoint13(f,d)+1/3*f,
                Midpoint13(f,c)+1/3*f,
                Midpoint13(g,b)+1/3*g,
                Midpoint13(g,a)+1/3*g,
                Midpoint13(f,h)+1/3*f,
                Midpoint13(f,g)+1/3*f,
                Midpoint13(g,f)+1/3*g,
                Midpoint13(g,e)+1/3*g],
               [Midpoint13(g,a)+1/3*g,
                Midpoint13(g,b)+1/3*g,
                Midpoint13(g,c)+1/3*g,
                Midpoint13(g,d)+1/3*g,
                Midpoint13(g,e)+1/3*g,
                Midpoint13(g,f)+1/3*g,
                g,
                Midpoint13(g,h)+1/3*g],
               [Midpoint13(h,b)+1/3*h,
                Midpoint13(g,a)+1/3*g,
                Midpoint13(g,d)+1/3*g,
                Midpoint13(h,c)+1/3*h,
                Midpoint13(h,f)+1/3*h,
                Midpoint13(g,e)+1/3*g,
                Midpoint13(g,h)+1/3*g,
                Midpoint13(h,g)+1/3*h],
               [Midpoint13(h,a)+1/3*h,
                Midpoint13(h,b)+1/3*h,
                Midpoint13(h,c)+1/3*h,
                Midpoint13(h,d)+1/3*h,
                Midpoint13(h,e)+1/3*h,
                Midpoint13(h,f)+1/3*h,
                Midpoint13(h,g)+1/3*h,
                h],
               [Midpoint13(e,d)+1/3*e,
                Midpoint13(e,c)+1/3*e,
                Midpoint13(h,b)+1/3*h,
                Midpoint13(h,a)+1/3*h,
                Midpoint13(e,h)+1/3*e,
                Midpoint13(e,g)+1/3*e,
                Midpoint13(h,f)+1/3*h,
                Midpoint13(h,e)+1/3*h]
                          )
                     end:
RefineAll := proc(tlist)
    RETURN(map(Refine,tlist));
  end:
Recurse := proc(f, input, n)
    if ( n <= 0) then
       RETURN(input);
    else
       RETURN(Recurse(f, f(input), n-1));
    fi;
  end:


FirstC := [[-1,-1,-1],
           [1,-1,-1],
           [1,1,-1],
           [-1,1,-1],
           [-1,-1,1],
           [1,-1,1],
           [1,1,1],
           [-1,1,1]]:
|
Now we setup some plotting options to Maple.
|
Ustawiamy opcje wyświetlania wykresów w Maple'u.
|
|
with(plots):
setoptions3d(axes=none, scaling=constrained,shading=XYZ,style=patch,
orientation=[65,66],projection=0.7,lightmodel=light4);
|
And now to some example plots
|
A teraz przykładowe wykresy
|
|
polygonplot3d(Cube(FirstC));
 polygonplot3d(map(Cube,Recurse(RefineAll,[FirstC],1)));
 polygonplot3d(map(Cube,Recurse(RefineAll,[FirstC],2)));
 # Caution, might take a while
# Wyliczenie tego moze potrwac kilka minut
polygonplot3d(map(Cube,Recurse(RefineAll,[FirstC],3)));
# Caution, might take a while
# Wyliczenie tego moze potrwac kilka minut
polygonplot3d(map(Cube,Recurse(RefineAll,[FirstC],3)));
 # Make sure you have a least 2.5 GB of RAM to try the plot below
# Nie uruchamiaj tego ponizej jesli nie masz przynajmniej 2.5 GB RAM
polygonplot3d(map(Cube,Recurse(RefineAll,[FirstC],4)));
# Make sure you have a least 2.5 GB of RAM to try the plot below
# Nie uruchamiaj tego ponizej jesli nie masz przynajmniej 2.5 GB RAM
polygonplot3d(map(Cube,Recurse(RefineAll,[FirstC],4)));